Tag Archives: slope

College Algebra with Christopher

If you assume that Double Stuf Oreos are doubly stuffed (which may turn out to be false), then using the Nutrition Facts labels, you can write the following system of equations, where x represents the number of calories in one wafer and y represents the number of calories in a single layer of stuf.

\begin{cases} 6x+3y=160\\4x+4y=140\end{cases}

The first line represents the caloric content of a single serving (three cookies) of Regular Oreos; the second line represents the caloric content of a single serving (two cookies) of Double Stuf Oreos.

Getting to this system represents some effort on the part of me and my College Algebra students. They are wont to represent their work arithmetically; my job is to help them to transition this arithmetic problem solving to algebraic generality. It is work that I love, but it is hard work.

We had gotten ourselves there, and we had discussed the importance of being very clear about the meanings of our variables when I presented the following graph in class yesterday.

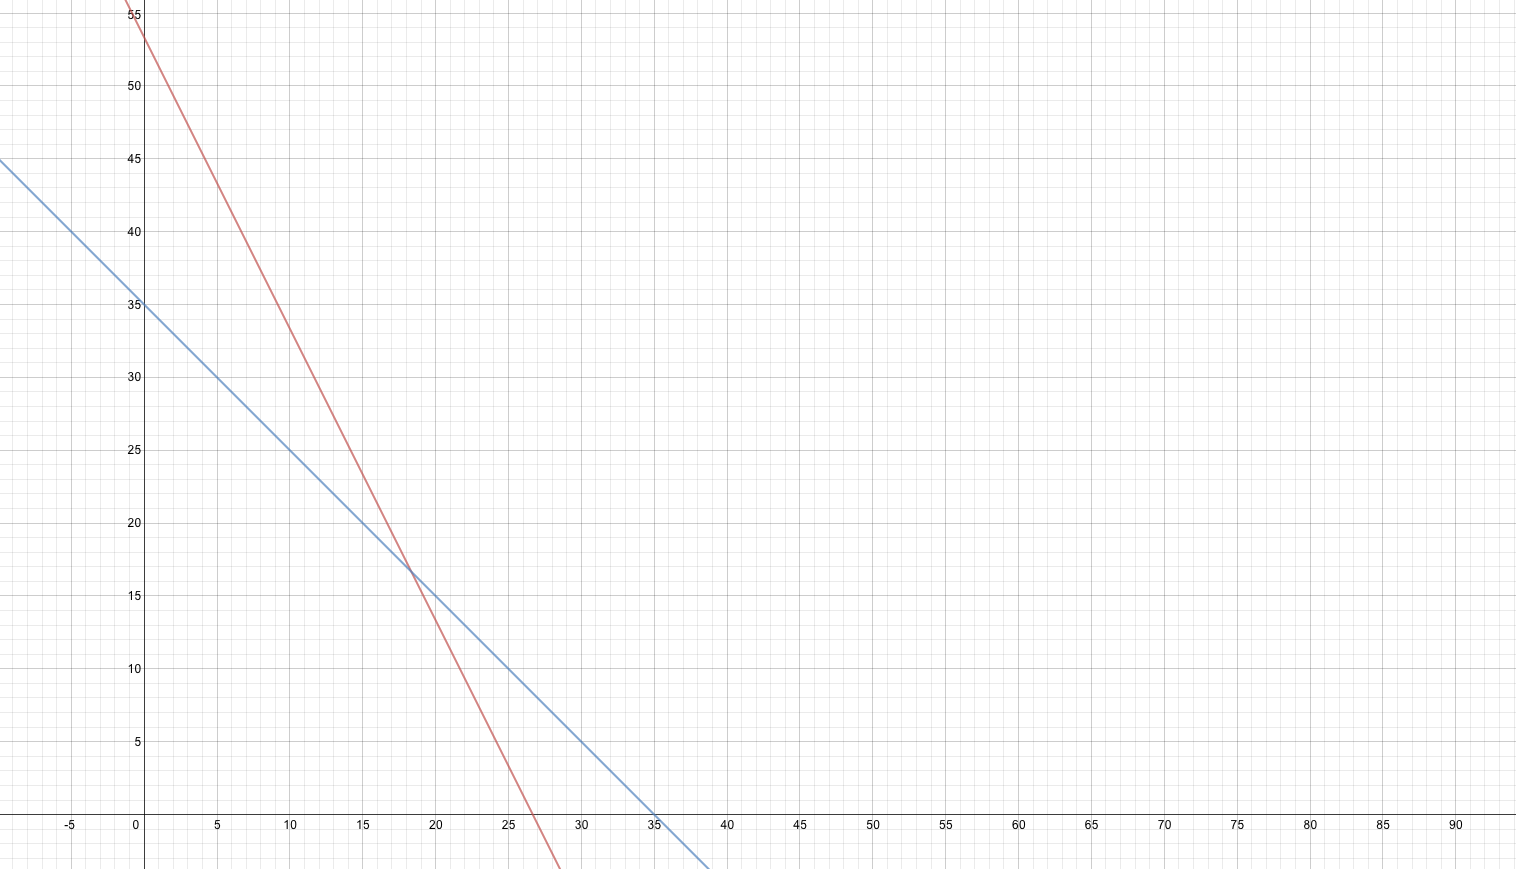
The basic questions in front of us were, What does the blue line represent? What does the red line represent? What is the meaning of this graph?

We had a number of false starts and hesitations. After a few minutes of this, a student pointed our attention to the slope of the red line.

Student: The slope is –2.

Me: Why is it negative?

Student: Because it goes down.

Student: Because if you count the squares over and the squares down, and write rise over run, it’s negative 2, which means the line goes down.

Me: Right. But what does that have to do with Oreos?

A few moments of contemplative silence from 44 college students.

Student: There are twice as many wafers as stufs in the regular Oreos, and the red line represents the regular Oreos.

Me: Right. But why negative?

A few more moments of contemplative silence from the group. This is not a routine they are familiar with, but they are working hard to acculturate themselves to these new expectations.

Me: OK. Let’s do this. Write your answer to this question in your notes.”What is the meaning of x on this graph?”

I allow a few moments for this to occur.

Me: Raise your hand if you wrote that “x represents wafers”.

About 80% of hands go up. I contemplate this. Then…

Student: Isn’t it “number of calories in one wafer”?

Now we have something to work with!

The goods [#NCTMDenver]

Good turn out for my session Saturday morning (EIGHT O’CLOCK!).

Thanks to Ashli Black (@Mythagon) for the shot of title screen.

I’ll get some more details up here sometime soon. In the meantime, here’s the handout (.pdf). And here’s the slide deck (.zip, and which—to be honest—was just a photo album on the iPad; the simplicity of this was liberating).

Here are Alison Krasnow’s notes from the session.

road.to.calculusOne last thing…this is the absolute best form of session feedback, as far as I am concerned—getting to read someone else’s notes on the session speaks volumes about what participants experienced (in contrast sometimes to what I think we did).

The slides:

UPDATE: This talk has been adapted to a paper submitted to Mathematics Teaching in the Middle School. I’ll keep you posted on its progress.

QMS XI: Calculus

From the usual source:

Can you post a calculus problem and solution so we can see what it looks like?  Also, how and where would you use it in the world?

There are three major ideas of Calculus. I’ll tell you about the first two, since they’re the ones that are easy to wrap your mind around. Then I’ll finish with the third. The first two are:

  1. Derivative and
  2. Integral

derivative

A derivative is a slope. Pure and simple. Just as slope in seventh and eighth grade is the rate of change of one variable with respect to the other, derivative is the rate of change in calculus. I don’t mean this metaphorically; they are the same thing.

In algebra, slope has to do with straight lines. If Emile walks 75 meters in 30 seconds, you have no trouble figuring out how many meters per second he walks. That’s his walking rate; it’s the slope of his line. In calculus, we would say that this is the derivative of his walking function.

But what if his rate isn’t constant? What if he starts off slowly and speeds up as time goes by? What if his walking function is more complicated than y=2.5x? You get a taste of how to figure rates (slopes) of non-linear relationships when you work on first and second differences in studying quadratic or exponential relationships.

But first and second differences give us average rates of change. Calculus is interested in instantaneous rate of change-not just what is the average speed between 2 and 3 seconds? but how fast is this thing moving right now?

Consider the video below:

How does the speedometer work? Calculus answers that question using derivatives.

If we model the car’s distance traveled as a function of time:

Then we write:

We read this as The derivative of f with respect to t. When we specify f as a function, the derivative is a function. When we also specify a number t, then the derivative has a numerical value. That value is the speed at the time we selected.

INtegral

Going back to Emile who walks 2.5 meters per second. If you know his walking rate and how long he walks, you can figure out how far he walked. And you do that frequently in algebra.

But what if his walking rate is changing? Now it’s a much harder problem, and it requires more advanced mathematical techniques. Go back to the video:

How far did the car travel in going from 0 to 60? Now, strictly speaking you don’t need Calculus to answer this. You could mark the beginning and end of the run and measure it. But what if it’s an airplane and you need to know how long to make the runway? What if it’s the Space Shuttle? These would be harder to measure directly. The Calculus idea of integral solves these kinds of problems.

If we model the car’s speed as a function of time from time 0 to time a (meaning whenever the car gets to 60 mph):

Then we would write:

And we read this as The integral from 0 to a of g of t. After specifying g as a function and a as a number, this integral has a numerical value-the distance the car traveled.

limit

Now think about what you know in algebra. To find Emile’s speed, you divided his distance by his time. No matter what two points you choose on Emile’s graph, the difference in distance divided by the difference in time will be the same. But when his walking rate is changing, that’s not true. The average speed will depend on which points you choose. And as a general rule, the average speed between two times will not be the exact speed he is traveling at either time.

So mathematicians get a better approximation of the speed at a given time by taking averages over small intervals of time. And they imagine an answer to the question, What if we averaged his speed over 0 seconds? This would mean dividing by zero, which is impossible. The third major idea of Calculus-limit-gets around this technicality.

Derivatives are defined in terms of limits.

And so are integrals for a similar reason. Our attempts to precisely answer questions about how far the car travels in getting to 60 mph inevitably lead to adding up infinitely many numbers. We literally do not have time for that. Limits get us around this problem, too.